VICTORIA GEDDES, Executive Director
Activism in Australia is highly concentrated by sector, market cap and demand type. It is focused on the basic materials sector, in nano cap stocks and with two-thirds of demands on changes to the board. This is highly unusual in a global context where activity is more evenly spread across sectors and size by market cap. In this blog we look at how the structure of Australian activism compares to other countries.
Australian Activism by Sector °
| Sector | 2014 | 2015 | 2016 | 2017 | 2018 | 2019 | 2020 | 2021 | 2022 | 2023 | 2024 YTD |
|---|---|---|---|---|---|---|---|---|---|---|---|
| Basic Materials | 30 | 38 | 23 | 28 | 32 | 39 | 30 | 34 | 36 | 31 | 14 |
| Communication Services | 0 | 0 | 0 | 0 | 0 | 0 | 0 | 2 | 2 | 1 | 0 |
| Consumer Cyclical | 4 | 3 | 5 | 6 | 6 | 13 | 10 | 6 | 3 | 2 | 5 |
| Defensive | 2 | 2 | 3 | 5 | 6 | 5 | 1 | 1 | 5 | 4 | 0 |
| Energy | 11 | 11 | 15 | 16 | 14 | 4 | 11 | 9 | 10 | 9 | 9 |
| Financial Services | 6 | 10 | 6 | 3 | 8 | 16 | 12 | 13 | 13 | 11 | 2 |
| Funds | 0 | 0 | 3 | 3 | 2 | 6 | 2 | 2 | 0 | 0 | 1 |
| Healthcare | 1 | 1 | 2 | 5 | 5 | 10 | 3 | 0 | 5 | 5 | 2 |
| Industrials | 7 | 3 | 2 | 6 | 8 | 7 | 10 | 4 | 7 | 7 | 2 |
| Real Estate | 1 | 2 | 3 | 7 | 4 | 1 | 3 | 3 | 1 | 0 | 1 |
| Technology | 6 | 1 | 6 | 8 | 11 | 6 | 10 | 7 | 4 | 4 | 4 |
| Utilities | 1 | 2 | 2 | 1 | 2 | 2 | 3 | 3 | 9 | 1 | 0 |
| Total | 69 | 73 | 70 | 88 | 98 | 109 | 95 | 84 | 95 | 75 | 40 |
The sector where activism dominates in Australia is, and always has been, the Basic Materials sector with 35-45% of campaigns over the past decade focused on these companies. If we focus on the past 5 years, there is daylight between Basic Materials and the next most targeted sectors – Energy (10%) and Financial Services (14%).
This level of dominance contrasts with the experience of other countries including Canada, our closest peer, where their Basic Materials and Financial Services sectors attract the most activism but each accounts for only around 20% of the total (average over the 5 years to 2023).
The big economies like Europe, the US and Japan are similarly less concentrated in terms of their sector risk, as the table below, which lists the top 3 sectors in each country/region, illustrates.
Consumer Cyclical, Industrials and Technology are the sectors most targeted in these economies while in Australia they each account for only 7% of activity over the same period.
Top 3 Sectors °
| Campaigns* | % of Total | ||
|---|---|---|---|
| US | Consumer Cyclical | 132 | 17 |
| Technology | 118 | 15 | |
| Industrials | 108 | 14 | |
| EUROPE | Financials | 47 | 20 |
| Industrials | 35 | 15 | |
| Consumer Cyclical | 30 | 13 | |
| JAPAN | Consumer Cyclical | 28 | 30 |
| Industrials | 17 | 18 | |
| Technology | 10 | 11 | |
Australian Activism by Company Size
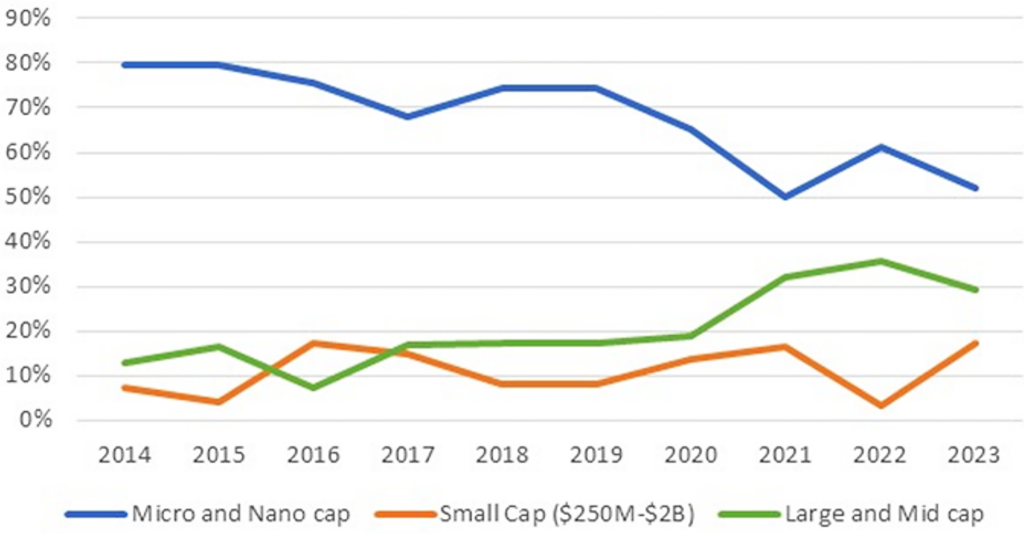
Up until 2019, 70-80% of activism occurred in microcap and nanocap stocks in the basic materials and energy sectors. As we discussed in our July article, activism generally has been in decline since 2019, falling 29% over 4 years.
Since 2014, while the proportion of activism in microcap and nanocap stocks remains dominant, it has fallen sharply to 50-60% since 2020.
Mid-cap and Large cap stocks now account for 30-35%, double the average of 15% over the previous 7 years.
Australian Activism by Market Cap °
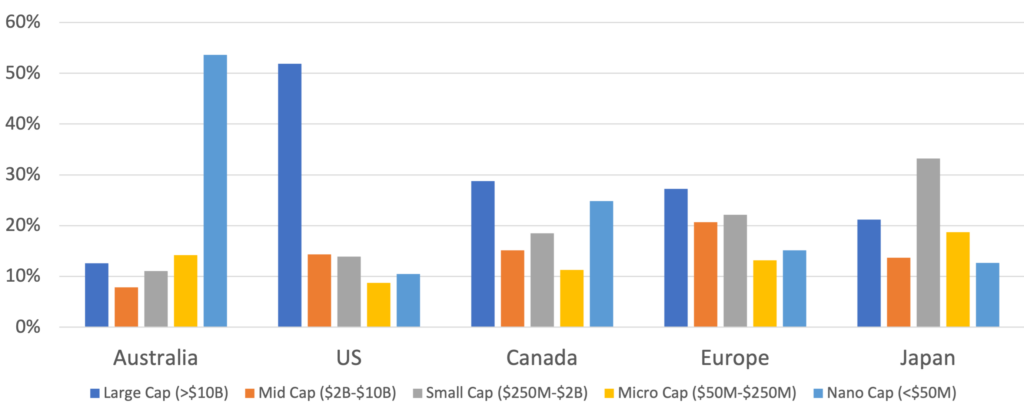
The chart below illustrates how much of an outlier both Australia (nano caps) and the US (large caps) are in terms of their heavy bias towards one particular segment of the equities market.
20-25% of activism in Canada, Europe and Japan are in large caps. Japan’s most active market segment is in small caps (33%).
Comparative Activism by Market Cap
(10 Year Average) °
What Activists are Most Upset About
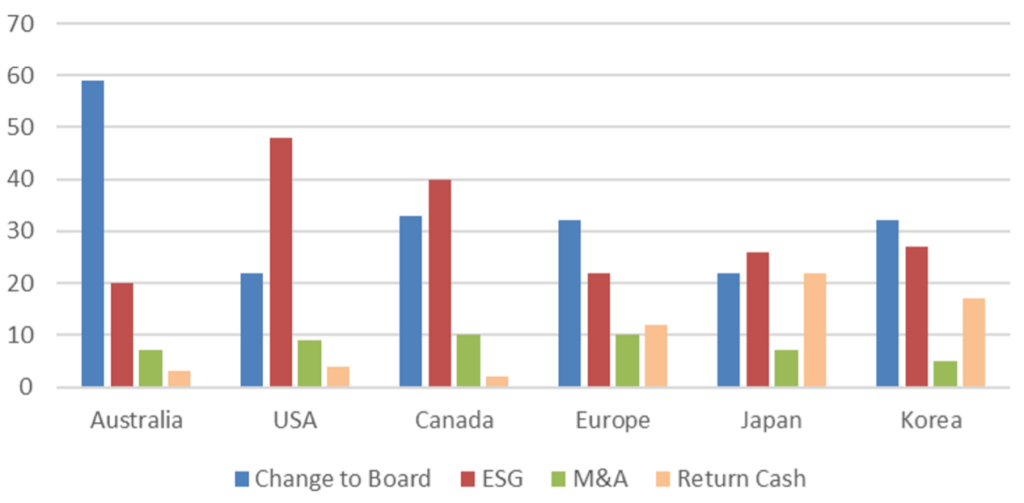
In Australia, seeking changes in personnel either through adding people to the board or removing board members/the CEO (or both) is largely the only game in town. Ten years ago this represented 80% of activism, but in the last 5 years has fallen to an average of 60% and is largely responsible for the overall decline in activism during that time.
In its place ESG activism has been gathering pace, an area inhabited by the large and mid-cap stocks, and this now accounts for 20% compared to nothing in 2013.
Annual Average Demands 2019-2023
(% of total) °
Changes to the board are a feature of activism globally but only in Europe and Korea (c.30%) do they assume primary importance alongside Australia.
In North America the emphasis is on ESG (40-48%) while in Australia, Europe, Japan and Korea ESG accounts for 20-25% of all demands, half that of North America.
Japan and Korea stand apart with their focus on return of cash while M&A activism ranks 3rd for Australia, US, Canada and Europe, with each sitting around 7-10%.
Does an Activist Campaign gain you a Board Seat?
An analysis of campaigns in Australia over the past decade, where the activist sought to gain board representation, reveals that 80% were successful and another 14% were partially successful.
Of the 275 board seats that were proposed across 183 campaigns, 219 were gained – an 80% success rate. Importantly only 25% of these campaigns had to go to a proxy contest or meeting of shareholders to achieve this outcome.
By implication boards are prepared to negotiate with the activist to avoid having to go to a meeting. Also it is likely that these stats are conservative as they don’t capture private settlements before an activist launches their public campaign by sending a s249D notice to a company. What it does tell us however is that this action, once taken, can be all that is needed to achieve the desired outcome.
FIRST Advisers has been supporting companies in their activist defence as well as working with activists for the past 15 years. We take an integrated approach to each campaign with all parts of our business working closely together to create a tailored solution which may include register analytics, shareholder engagement, media and investor relations.
-
- Data sourced from Diligent Corporation and FIRST Advisers


