SALONI SURI, Shareholder Analytics
During August we monitored companies in the ASX300 Index that reported for the period ending 30 June 2022 (FY22). Around 80% of companies in the S&P/ASX 300 index released their results during August 2022, with large companies particularly well represented. This enabled us to build a representative picture of the approach to guidance in this market and what that guidance is telling us about outlook for FY23.
While we have updated this research annually since August 2018 (FY18 results), this is our first update since our analysis of results reporting in February 2021 – a period in which companies were 12 months into the pandemic and well accustomed to the new normal of dealing with borders closures, lockdowns and supply chain issues. At that time, despite the high level of economic uncertainty associated with the ongoing impact from the pandemic, the number of companies offering guidance increased. In 2022 geopolitical factors and their contribution to rising inflation have replaced Covid as the key destabilizers of the economic outlook which grows increasingly dire by the day. So, how has this influenced companies’ readiness to commit to providing guidance on the outlook this time around?
Companies increasingly reluctant to provide guidance
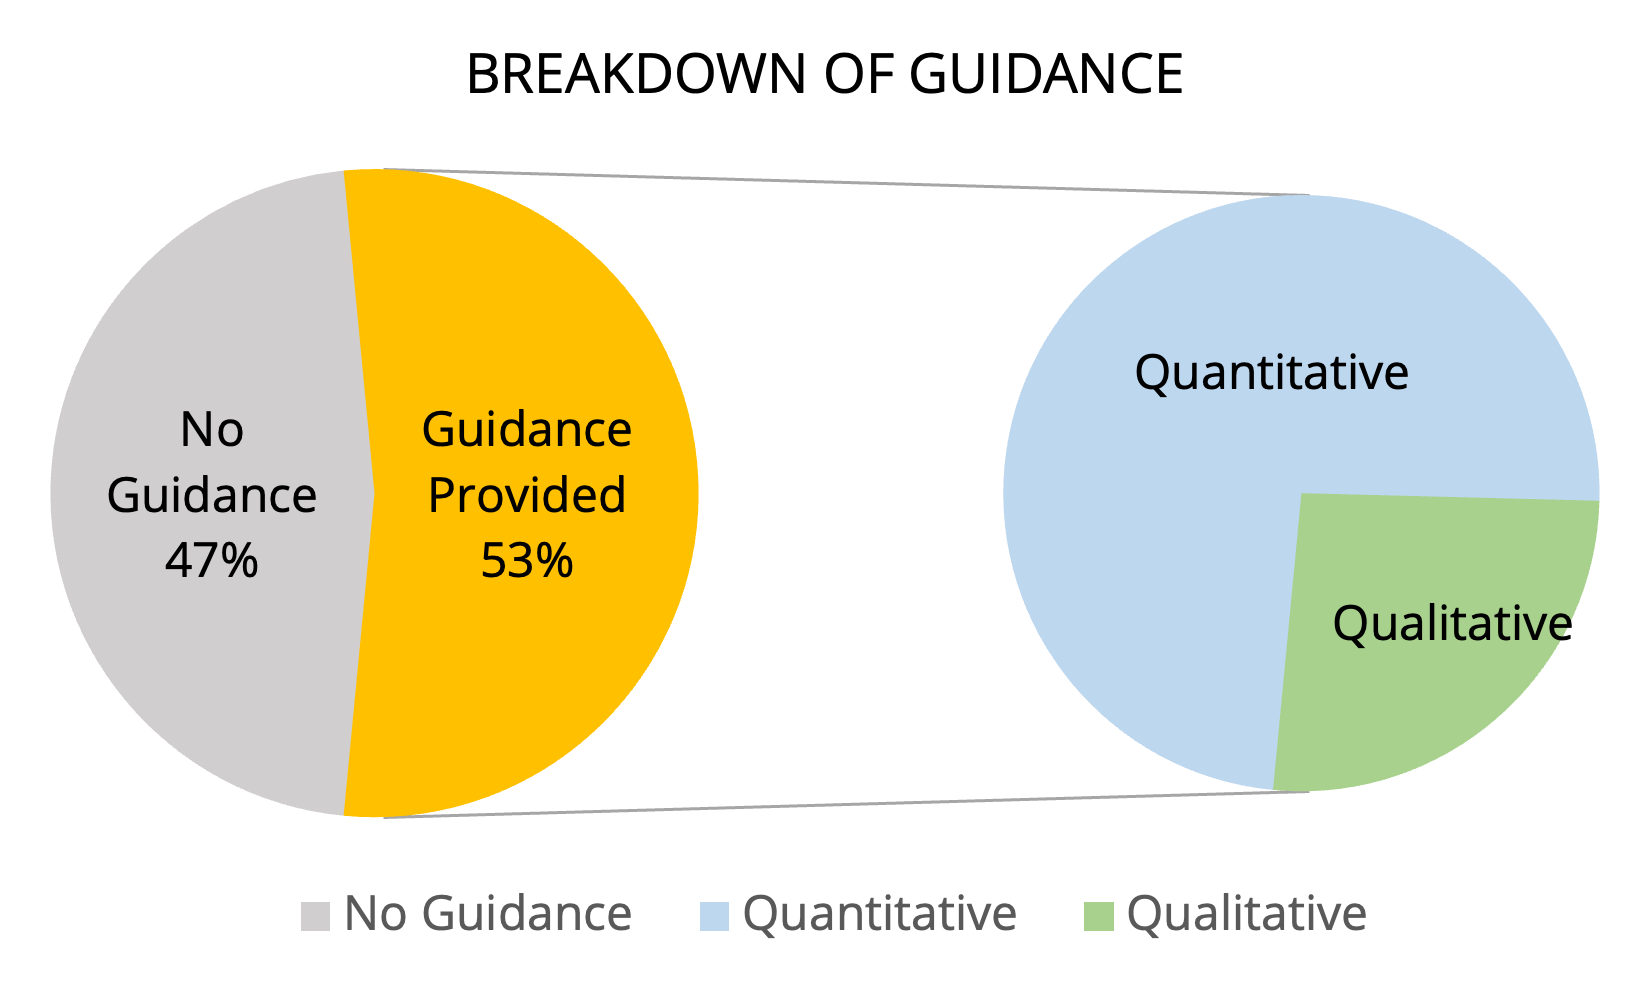
While the majority of companies (53%) which reported in August 2022 gave some form of guidance there was a major reduction from our observations in February 2021 (70%) and August 2019 (60%).
Of the companies that gave guidance, 74% chose to do so quantitatively which was slightly higher than February 2021 (70%) but lower than pre-Covid in August 2019 (80%). The remaining 26% provided qualitative guidance (compared to 30% at February 2021 and 20% at August 2019).
Outlook is mostly positive
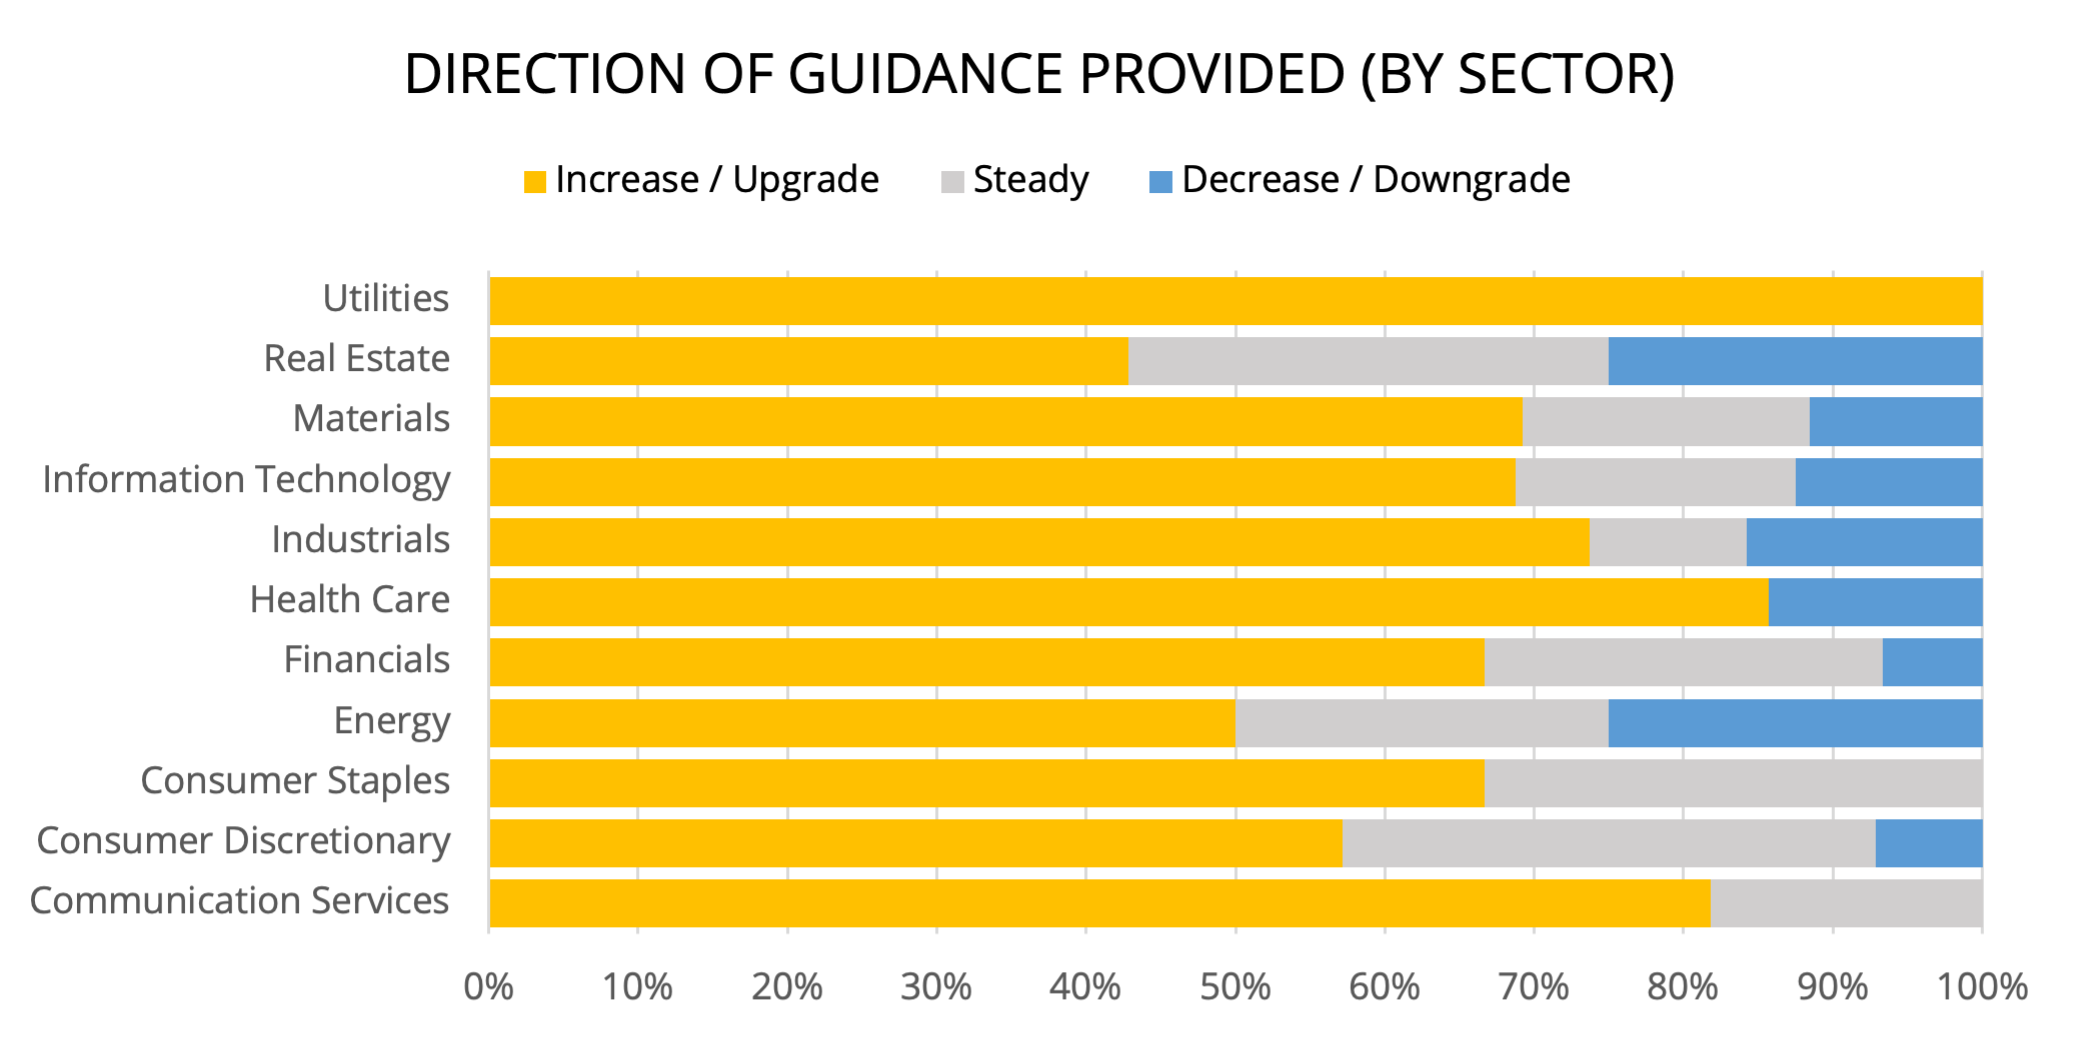
65% of companies providing guidance expected their next full year result to be above their most recent. This level of optimism is similar to the 68% of companies that provided guidance in February 2021.
The most optimistic sectors were Communication Services, Consumer Staples and Utilities which did not have a single constituent reporting a negative outlook.
The most pessimistic sectors were Real Estate and Energy, where 25% of companies expect a slowdown in FY23.
Differences between Sectors
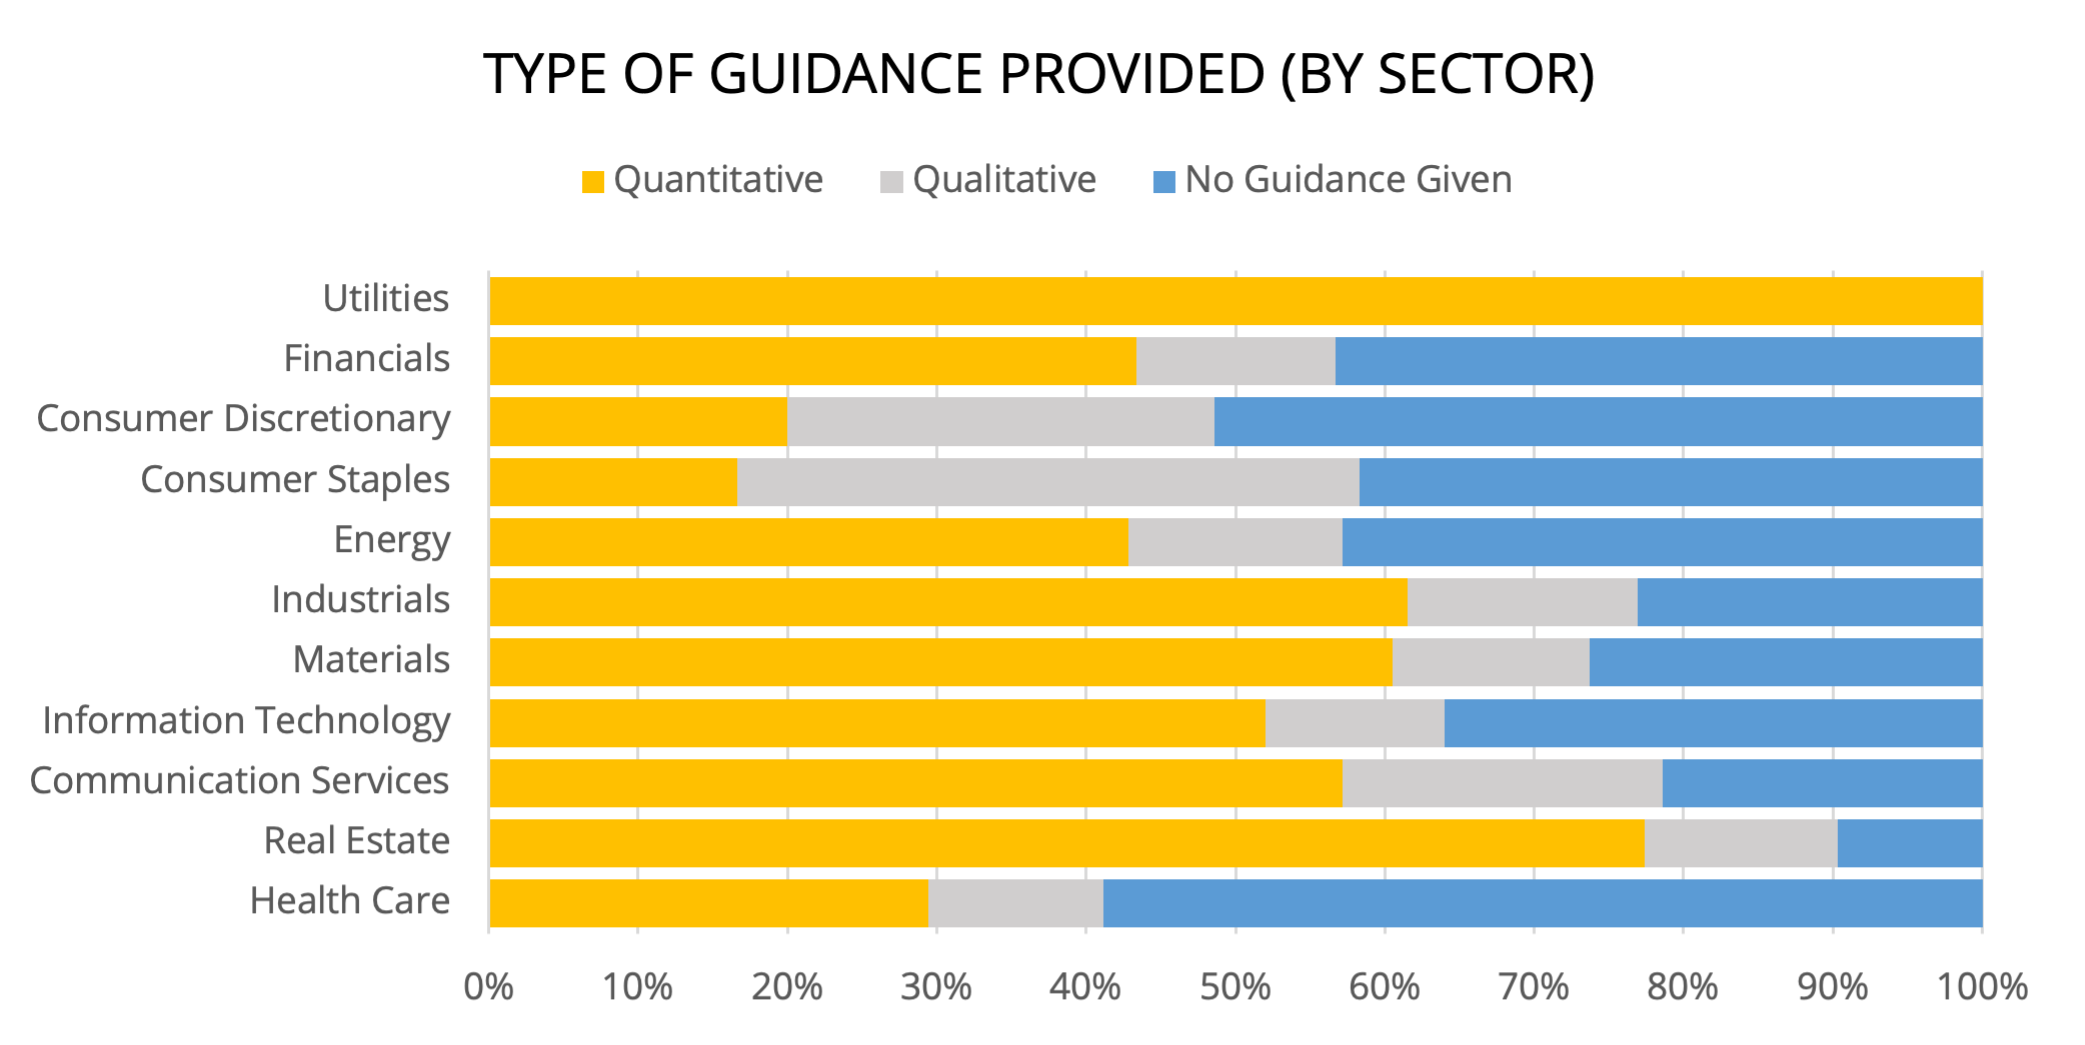
The sectors that were most forthcoming with guidance were Real Estate (90%), Communication Services (79%), Industrials (77%) and Materials (74%). At least half of reporting companies in the Consumer Discretionary and Health Care sectors did not give any FY23 guidance.
Quantitative feedback was most common for Real Estate (77%), Industrials (62%) and Materials (61%) companies. Consumer Staples reported the highest qualitative guidance (42%), which is consistent with their reporting in February 2021 (43%).
EBITDA and NPAT were the preferred earnings guidance metrics
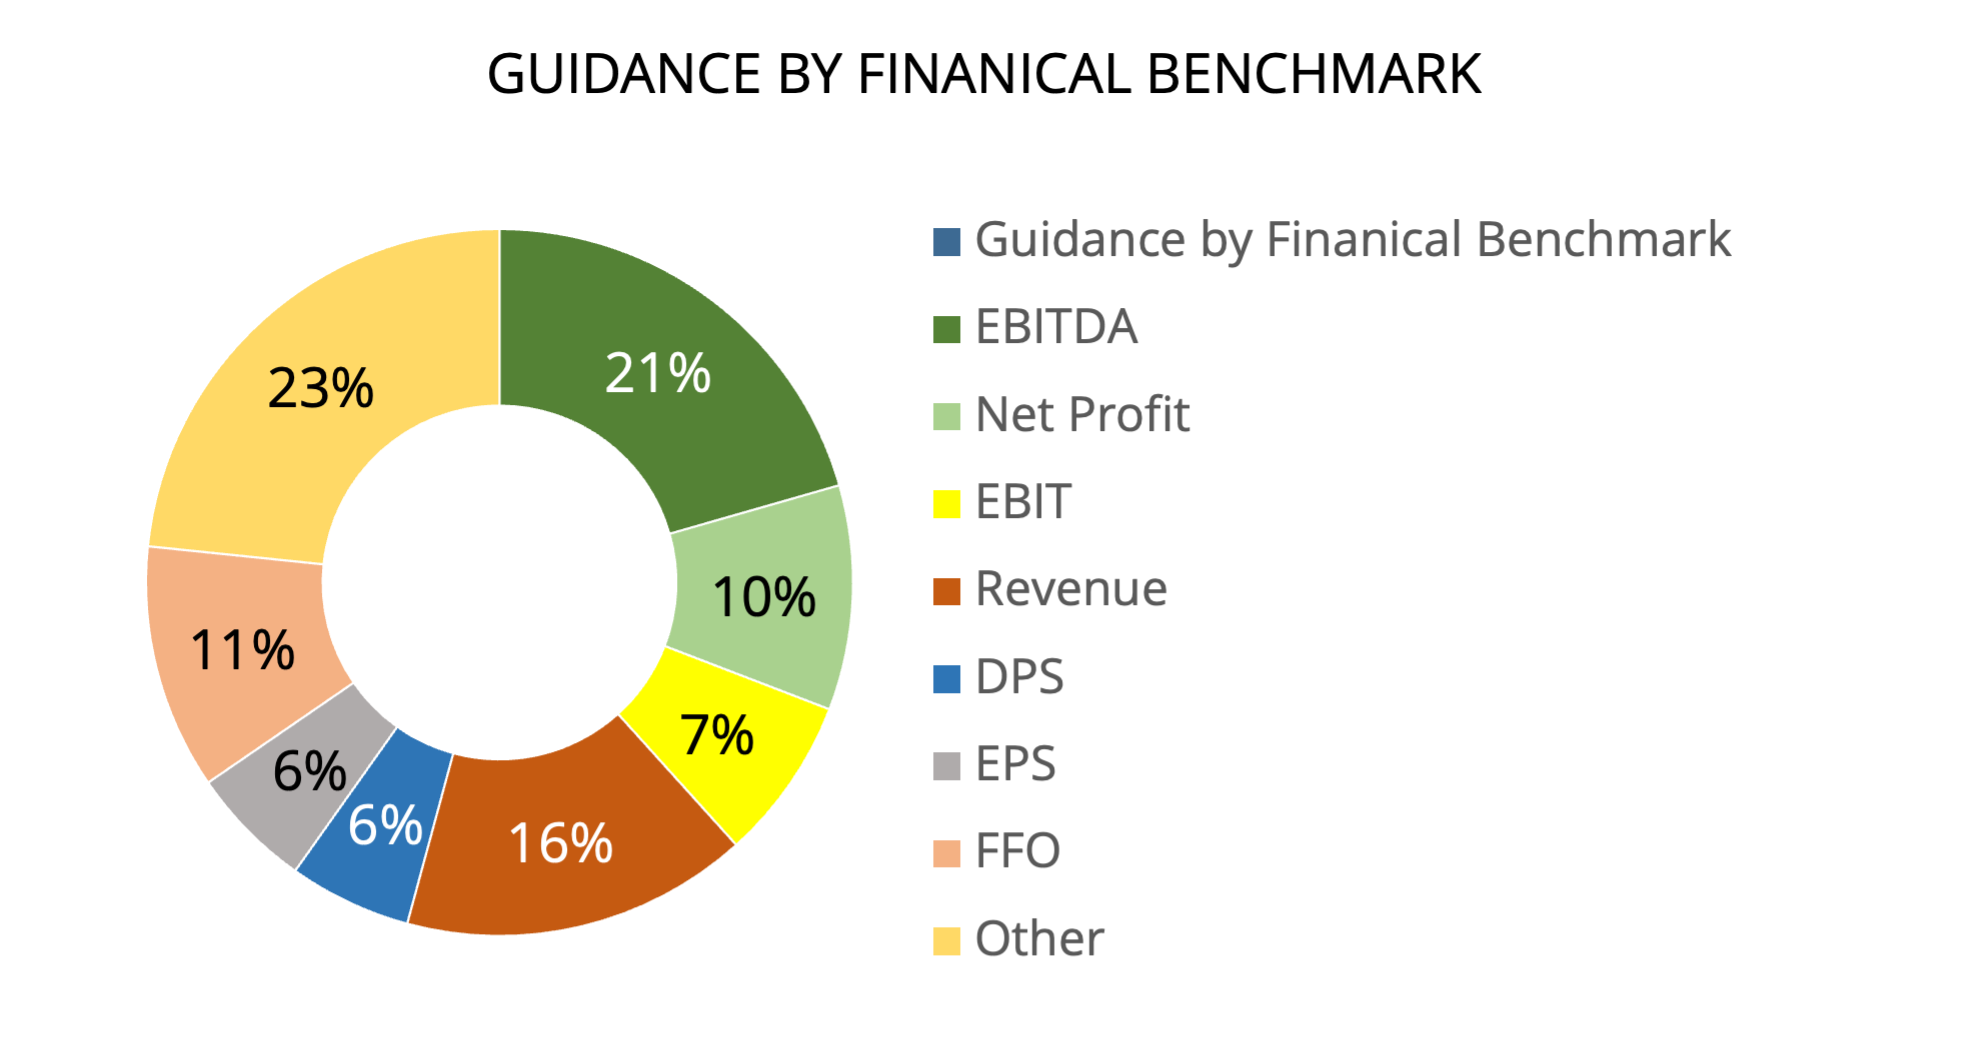
While EBITDA and NPAT (31%) dominated earnings guidance, 54% of the companies that provided financial guidance, focused on EBITDA, EBIT, Revenue or NPAT.
Sectors that provide the majority of financial guidance using Revenue, EBITDA, EBIT or Net Profit include Information Technology (79%), Communication Services (70%), Industrials (80%) and Consumer Staples (60%).
Real Estate companies tended to use Funds from Operations (FFO) as a common metric for guidance.
Not all guidance was financial
The number of companies giving guidance using operational metrics was 21%, which is consistent with our findings in August 2019. Production and Capital Expenditure were the most common types of non-financial guidance used. The sectors that provided the most non-financial related guidance were Materials (81%) and Energy (50%). For the Materials sector this represented a large increase compared to FY19 (68%) while qualitative guidance from Energy companies fell noticeably (from 66%) over the same period.
Guidance by Index
Companies in the S&P/ASX 51-100 provided a higher proportion of quantitative guidance (57%) compared to those in the S&P/ASX 201-300 (48%). Interestingly companies in the S&P/ASX 20 were relatively more reticent to use quantitative guidance (44%) but tended to be more open to providing qualitative measures (25%) than others in the top 300. By contrast companies in the S&P/ASX 21-50 had the highest proportion giving no guidance (39%) as well as the smallest (9%) number opting to provide qualitative guidance.
The message from this is that market cap is not a good indicator of a company’s inclination to provide guidance and that across the top 300 around two-thirds of companies will provide some sort of guidance whether quantitative, qualitative or a combination of both.


