Dan Jones, Shareholder Analytics and IR
During February we monitored all companies in the S&P/ASX300 Index that reported for the period ending 31 December 2017, building a picture of the approach to guidance in this market and what that guidance is telling us about the outlook for FY2018.
There were 214 companies within the S&P/ASX 300 index which gave their results during February.
Large companies were particularly well represented among these, with all but four of the S&P/ASX 20 (ANZ, NAB, WBC and MQG) and 79 of the S&P/ASX100 reporting.
Outlook for FY18 remains overwhelmingly positive
84% of companies providing guidance expect FY18 earnings to be equal to or above that of FY17. This is marginally down from 93% in August 2017.
Unsurprisingly, the companies in sectors which provided proportionally more guidance – Real Estate, Consumer Staples and Information Technology – were more optimistic about FY18. Information Technology was the most optimistic sector, with all but one constituent predicting that FY18 would be an improvement on FY17, (CL1 expects a flat result), and no companies in the Real Estate or Industrials sectors forecasted a decline in FY18. Collectively, these three sectors accounted for 34% of reporting companies during February.
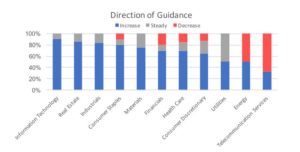 The sectors with the most pessimistic outlook were Telecommunications Services, where two thirds of companies are expecting a decline in earnings, Energy, where half of the companies expected a decline and Financials where almost a third of companies expected a decline. TLS (Telecommunication Services) and QBE (Financials) were the only S&P/ASX 20 Companies expecting a (modest) decline in FY18.
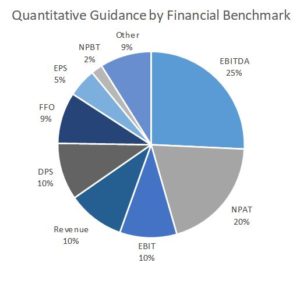
EBITDA and NPAT were the preferred financial guidance metrics (46%)
Of the most common quantitative guidance metrics – NPAT, EBITDA or EBIT – one quarter of all companies used EBITDA, 20% used NPAT and 10% used EBIT.
All of the Telecommunication Services and Consumer Discretionary companies that reported in February 2018 used NPAT EBITDA or EBIT to provide guidance. Other sectors where the majority of guidance was given using one of these measures include:
-
- 90% of Healthcare companies
- 67% of Industrials
- 67% of Utilities
- 63% of Consumer Staples
The majority of companies provide guidance
Almost three quarters of the companies who reported results in February 2018 provided some form of guidance compared with 87% of companies during the August 2017 reporting season. 65% of the companies reporting in February 2018 gave quantitative guidance compared to 92% in August 2017. Quantitative guidance uses some form of financial metric to measure performance.
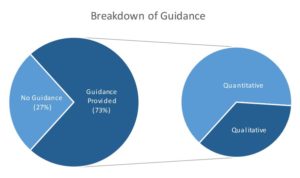
84% of companies reporting in February presented their Half Year Results, which may help explain the decline in the proportion
of companies giving guidance. Our analysis shows that companies reporting half year results give guidance 68% of the time compared to 74% of the time when reporting Full Year Results.
Guidance provided with Full Year Results was more likely to be quantitative (70% of the time) compared to guidance which accompanies Half Year Results (64%). Long-term outlooks (guidance provided for FY19 and beyond) proved much less common and significantly more qualitative in nature. Only 7% of companies provided some form of guidance beyond FY18, of which 80% was qualitative only.
Qualitative guidance could be more imaginative
In a continuation of an observation made during the August reporting period, the qualitative feedback provided around FY18 outlook (and beyond) was often quite vague, giving only a general overview of expectations.
Some outlooks focused on developments/acquisitions, without giving much attention to recurring business – ‘With the ANZ Wealth Management acquisition on the horizon, we are in a fantastic position to continue to grow well in the future.’
Other companies shared high level thoughts around macroeconomic trends, with no real mention of any profitability metric – ‘…market volatility remains a risk given ongoing global uncertainty… Low wage growth also impacts confidence…CBA will remain positive about Australia’s prospects, while being wary of these risks.”
Qualitative guidance, by its nature, does not include company specific performance metrics, however, outlook commentary should help investors form a view on the likely performance of a company. The provision of non-company specific data, e.g. macroeconomic data, industry or market specific trends, or environmental constraints can allow companies give context to their longer term outlook as part of providing qualitative feedback.
Larger companies gave qualitative guidance
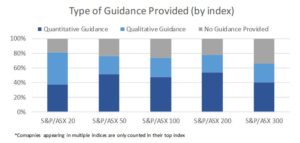
Constituents of the S&P/ASX 20 gave qualitative feedback 43% of the time, which was almost double the Ex-ASX 20 average of 25%. Many of these larger companies (e.g. BHP, RIO, CBA, AMP, WES) chose to breakdown and provide outlooks of individual business segments, which is likely reflective of their complex entity structures.
Difference between Sectors
By sector, Industrials and Real Estate (includes REITS) saw the largest proportion of their sector constituents reporting over the month (87% and 86%, respectively). Telecommunication Services companies, by contrast, were the least represented with four out of eight constituents reporting (50%).
Real Estate companies were the most forthcoming in the provision of guidance (94% of reporting companies), followed by Consumer Staples (85%), and Information Technology and Utilities (80% each). The Materials Sector was the only sector where less than half of reporting companies gave guidance (48%).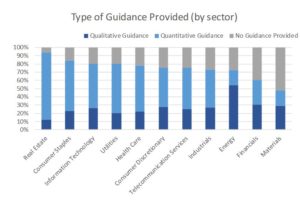
When comparing the types of guidance provided, companies in the Real Estate sector gave quantitative feedback 87% of the time – the highest of any sector. The Energy Sector lagged behind with just 25% of guidance quantitative in nature.
Materials companies were the largest providers of non-earnings related guidance, which usually came in the form of production estimates.