DAN JONES, MANAGER SHAREHOLDER ANALYTICS
During August we monitored companies in the S&P/ASX300 Index that reported for the period ending 30 June 2019, building a picture of the approach to guidance in this market and what that guidance is telling us about outlook for FY20.
Victoria Geddes, Co-founding Executive Director at FIRST Advisers said “If we look at the guidance for FY20, in the round, it shows that companies are more pessimistic than a year ago, continuing a trend we’ve seen developing since August 2017.
“A direct comparison of the guidance from August 2019 with August 2018 reveals Utilities, Consumer Stapes and Healthcare reported the largest negative changes.
“It is, however, by no means all doom and gloom. For instance, none of the Industrials that reported in August 2019 had a negative outlook.”
Around 80% of companies within the S&P/ASX 300 index released their results during August, with large companies particularly well represented. All but four of the S&P/ASX 20 (ANZ, NAB, WBC and MQG) and 80 of the S&P/ASX100 reported during the month.
Note: Unless otherwise stated, all guidance figures reported refer to the expected FY20 result.
The majority of companies provide guidance
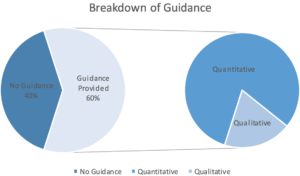
Just over 60% of companies which reported in August 2019 gave some form of guidance, which represented a slight reduction from August 2018 (66%). Of the companies that gave guidance, 80% chose to do so quantitatively, which was up from 71% in August 2018.
Outlook remains positive, but more cautious than previous years
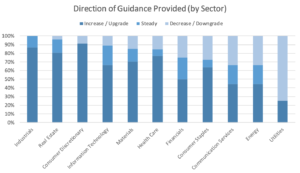
79% of companies providing guidance expected their next full year result to be equal to or above their most recent, which was slightly below our observations from February 2019 and August 2018, when 83% of guidance-providing companies expected improved conditions. This remains a more pessimistic view than the market held in February 2018 (87%) and August 2017 (93%).
The most optimistic sectors were Industrials, which did not have a single constituent reporting a negative outlook, followed by Consumer Discretionary and Real Estate.
There were several sectors where more than three quarters of companies that gave guidance expect their FY20 result to be at least as strong as FY19; Information Technology, Materials, Healthcare and Financials.
Utilities was the only sector where the majority of companies providing guidance expect a lower FY20 result. The next most pessimistic sectors were Communication Services and Energy, where a third of companies expect a slowdown in FY20.
When comparing the guidance provided in August 2018 to August 2019, the most improvement was shown in the Real Estate and Industrials sectors, while Utilities, Consumer Stapes and Healthcare reported the largest negative changes.
Differences between Sectors
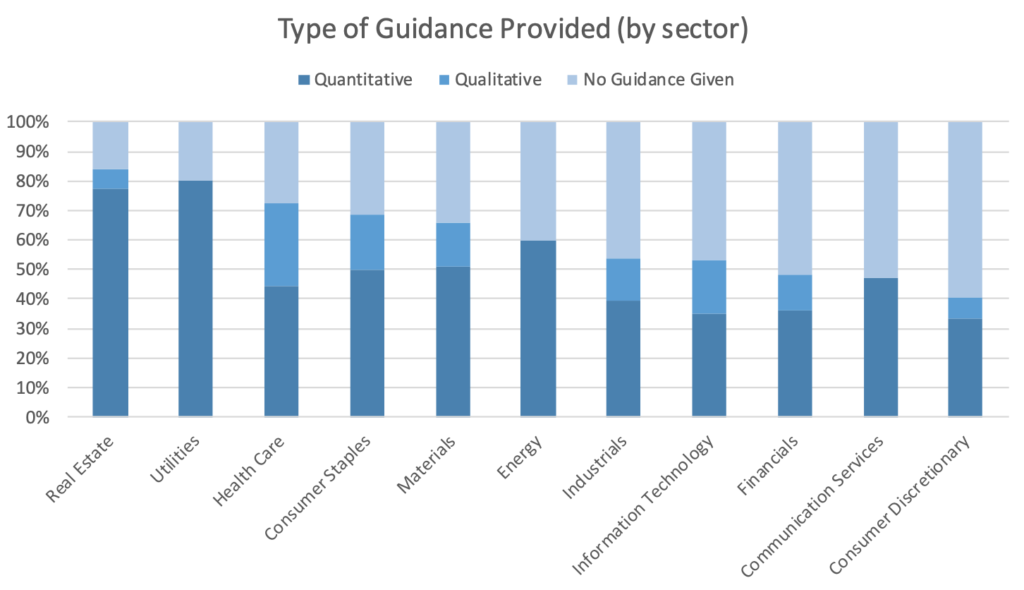
The sectors that were most forthcoming with guidance were Real Estate (84%), Utilities (80%), Health Care (72%) and Consumer Staples (69%). At least half of reporting companies in the Financials, Consumer Discretionary and Consumer Services sectors did not give any FY20 guidance.
Quantitative feedback was most common for Communication Services, Energy and Utilities sectors – where 100% of guidance provided was quantitative – followed by Real Estate (92%) and Consumer Discretionary (82%) companies.
EBITDA and NPAT remain the preferred financial guidance metric
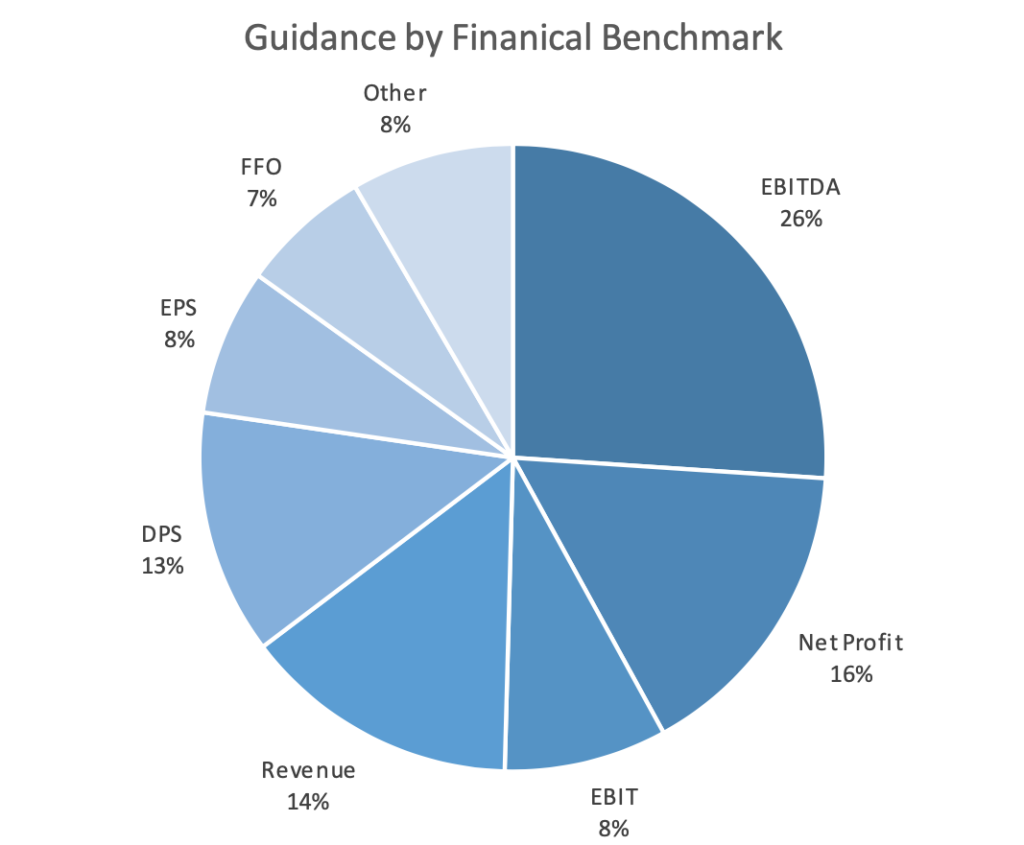
Of companies providing financial guidance, 51% came in the form of EBITDA, NPAT or EBIT, which is in line with 12 months ago.
Sectors that provide the majority of financial guidance using EBIT, EBITDA or Net Profit include Communication Services (88%), Consumer Staples (86%), Consumer Discretionary (78%), and Healthcare (73%).
Only 15% of Real Estate companies (largely REITs) chose to use one of these three metrics, instead preferring to use DPS or FFO.
Not all guidance was given using a financial metric
The number of companies giving guidance using operational metrics was 20%, which is consistent with our findings at August 2018. Production and Capital Expenditure were the most common types of non-financial guidance used. Unsurprisingly, the sectors that provided the most non-financial related guidance were Materials (68% of guidance was non-financial) and Energy (66%).
Larger companies gave qualitative guidance
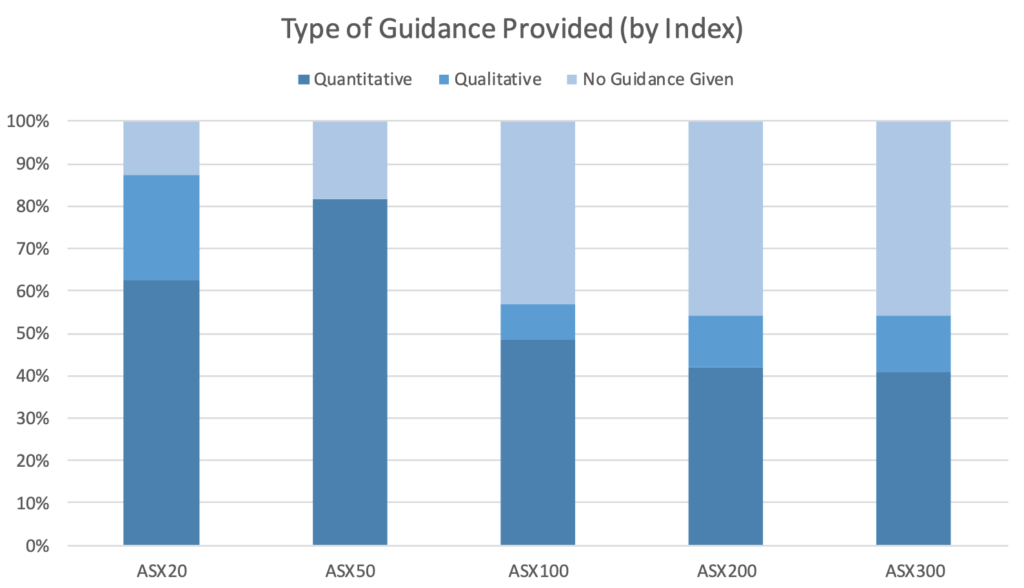
In February, companies outside the S&P/ASX 100 gave notably more guidance than in previous years, and a noticeably higher proportion of guidance provided was quantitative.
Note: Each company is counted only in its ‘top’ index
Relatively speaking, S&P/ASX 20 companies once again gave the highest amount of qualitative guidance, which was consistent with our previous years’ findings. Further, these companies tended to give outlook on a segment by segment basis, which is likely a reflection of their relatively complex business structures.
