DAN JONES, MANAGER SHAREHOLDER ANALYTICS
During February we monitored companies in the S&P/ASX300 Index that reported for the period ending 31 December 2018, building a picture of the approach to guidance in this market and what that guidance is telling us about outlook for FY19.
Around three quarters of companies within the S&P/ASX 300 index gave their results during February, with large companies particularly well represented. All but four of the S&P/ASX 20 (ANZ, NAB, WBC and MQG) and 80 of the S&P/ASX100 reported during the month.
*Note: Unless otherwise stated, all guidance figures reported refer to the expected FY19 result.
The majority of companies provide guidance
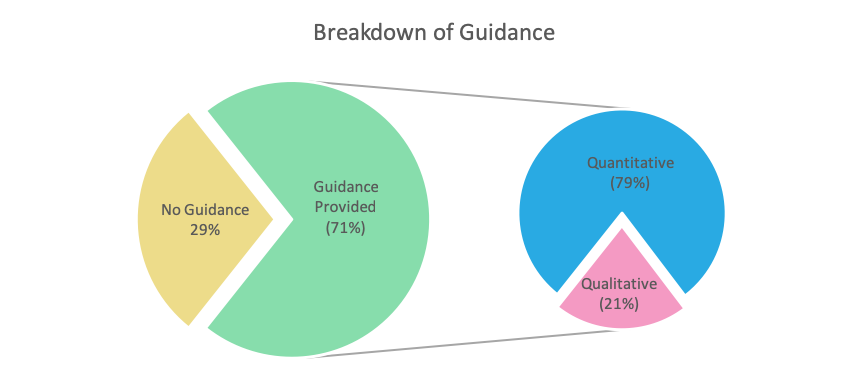
Just over 70% of companies which reported in February 2019 gave some form of guidance, which is an increase from the figure recorded in August 2018 (66%). Almost eight out of every ten companies that gave guidance chose to do so quantitatively, compared to seven out of ten in August 2018.
Differences between Sectors
By sector, Real Estate (includes REITS) and Industrials saw the largest proportion of their sector constituents reporting over the month (94% and 93%, respectively). By contrast, the least represented sectors during February were Financials (64% of constituents reported) and Materials (56%).
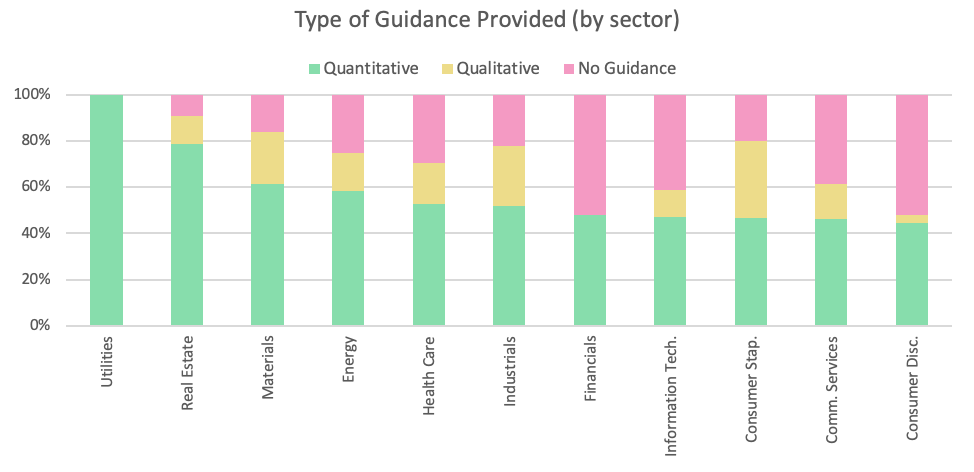
The sectors that were most forthcoming with guidance were Utilities (100%), Real Estate (85%), Materials (84%) and Consumer Staples (80%). At least half of reporting companies in the Financials and Consumer Discretionary sectors did not give any FY19 guidance.
Quantitative feedback was most common for Utilities and Financials (100% of guidance provided was quantitative), Consumer Discretionary (92%) and Real Estate (87%) companies.
Outlook remains overwhelmingly positive
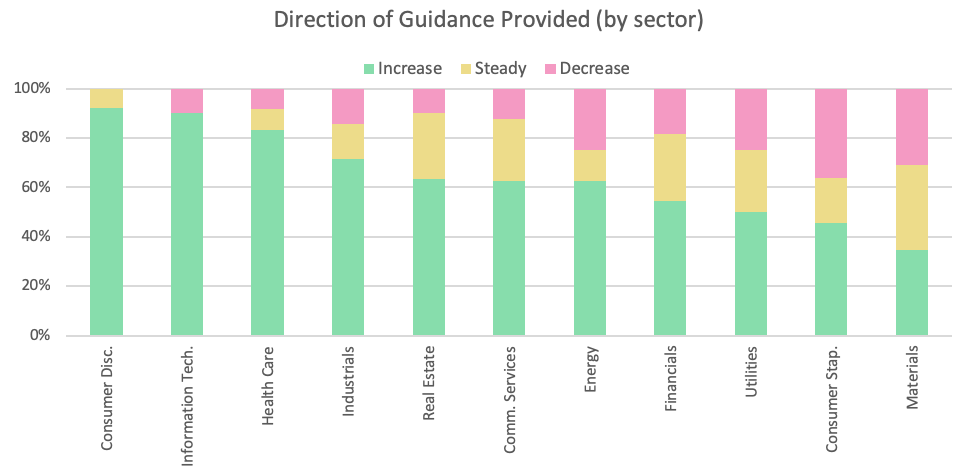
83% of companies providing guidance expected their next full year result to be equal to or above their most recent, which was in line with our observations in August 2018. This remains a more pessimistic view than the market held in February 2018 (87%) and August 2017 (93%).
The most optimistic sector was Consumer Discretionary which did not have a single constituent reporting a negative outlook.
There were several sectors where the majority of companies, more than 85%, that gave guidance expect their FY19 result to be at least as strong as FY18; Information Technology, Real Estate, Communication Services and Industrials.
Notably there was not a single sector where the majority of guidance provided was pessimistic. The sectors predicting the most headwinds were Consumer Staples (42% of companies expecting a lower FY19 result), Utilities (40%), Energy (33%) and Materials (31%).
Note: Due to an S&P restructure the Telecommunications Sector – which had consistently been the most pessimistic sector – now forms part of the broader Communications Services sector. No Telecommunications companies are predicting an improved result in FY19.
When comparing the guidance provided in August 2018 to February 2019, the Financials sector showed the most improvement, while the Materials sector reported the largest negative changes.
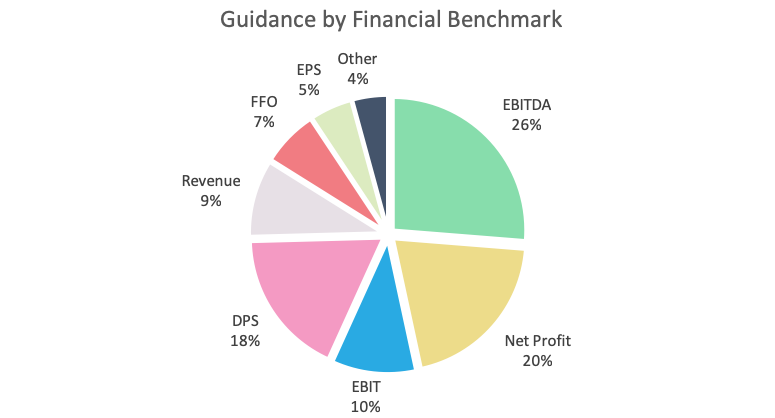
EBITDA and NPAT remain the preferred financial guidance metric (47%)
Of companies providing guidance, 57% came in the form of EBITDA, NPAT or EBIT, which is up slightly from August 2018 (51%), and in line with February 2018.
All companies in the Energy and Consumer Discretionary sectors that chose to use a financial metric to give guidance did so with EBIT, EBITDA or NPAT. Other sectors that provide the majority of financial guidance using these metrics were Materials (89%), Healthcare (82%), Communications Services (75%), Consumer Staples (71%), Utilities (67%) and Industrials (65%).
Only 11% of Real Estate companies (largely REITs) chose to use one of these three metrics, instead preferring to use DPS or FFO.
Not all guidance was given using a financial metric
The number of companies giving guidance using non-financial or operational metrics increased to 24%, up from 20% in August. Production and Capital Expenditure were the most common types of non-financial guidance used. Unsurprisingly, the sectors that provided the most non-financial related guidance were Materials (65% of guidance was non-financial) and Energy (66%).
Larger companies gave qualitative guidance
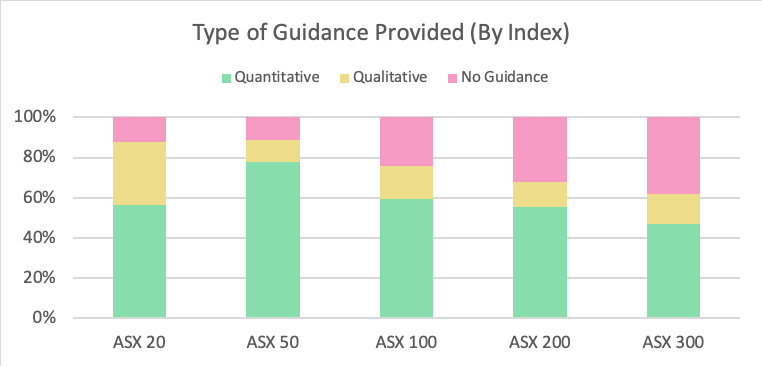
In February, companies outside the S&P/ASX 100 gave notably more guidance than in previous years, and a higher proportion of guidance provided was quantitative.
Relatively speaking, S&P/ASX 20 companies gave the highest amount of qualitative guidance, which was consistent with our August findings. Further, these companies tended to give outlook on a segment by segment basis, which is likely a reflection of their relatively complex business structures.
Note: Each company is counted only in its ‘top’ index
Some qualitative ‘guidance’ could add more value
Qualitative guidance is best utilized when discussing the influences of unpredictable variables on a company’s performance. Large companies, in particular, placed an emphasis on providing their outlook on broader macro-economic conditions over the coming year.
In a continuation of a previously observed trend, however, much of the qualitative feedback provided during the February reporting season was non-specific, giving only a general overview of expectations.
In some cases, company’s provided only broad statements around short term earnings, e.g.
‘Positive earnings momentum is expected to continue for the remainder of the year via organic growth and further realisation of synergies.’
Or looked vaguely at longer time horizons, but neglected the current financial year:
‘[The Company] remains confident that these investments will deliver sustainable double digit operating EBITDA and EPS growth in the medium to longer term.’
The incorporation of broader themes and observations, including longer-term expectations, into outlook can be a valuable exercise. However, this should be done in conjunction with specific forecasts (preferably quantitative) which aid an investors decision making process.
